| Symbol | Close Price | $ Change Today | % Change Today | 21′ YTD Change % | |
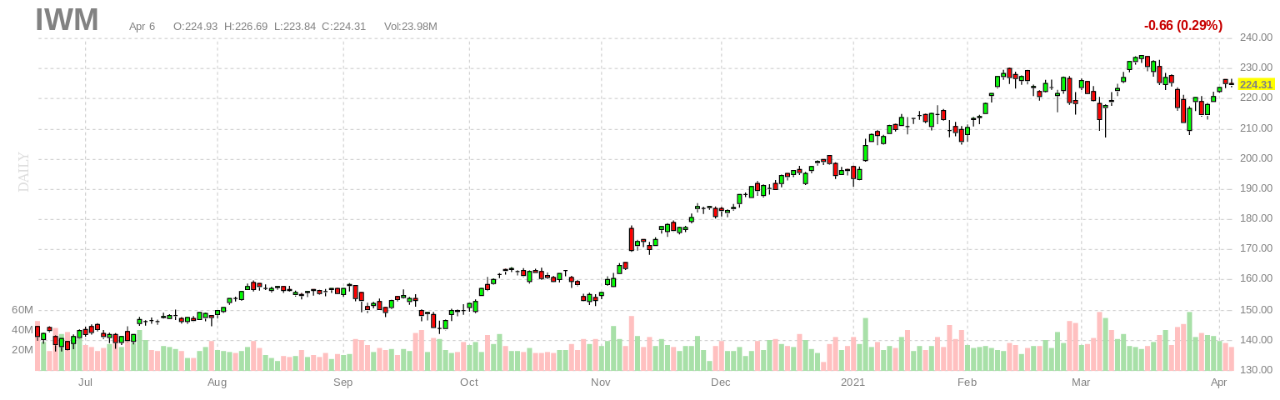
| IWM | IWM | 232.89 | 2.44 | 1.06 | 18.79 |
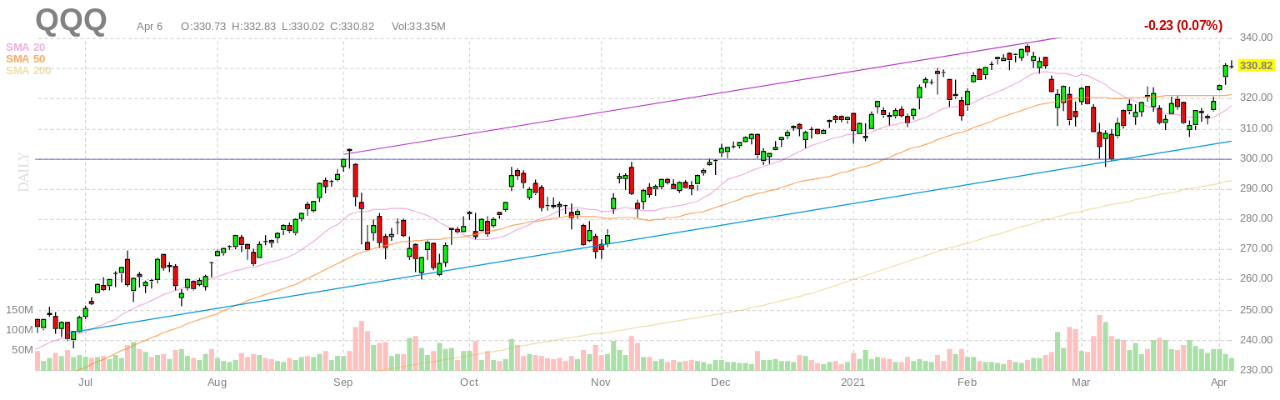
| QQQ | QQQ | 336.76 | 0.16 | 0.05 | 7.34 |
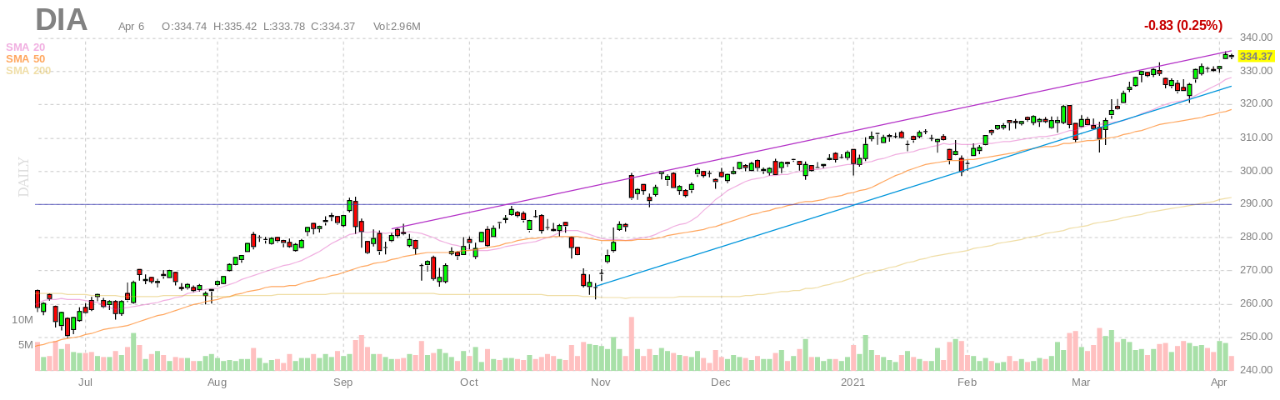
| DIA | DIA | 346.25 | -0.34 | -0.1 | 13.23 |
| SPY | SPY | 422.28 | 0.09 | 0.02 | 12.95 |
| VBR | VBR | 180.76 | 1.91 | 1.07 | 27.11 |
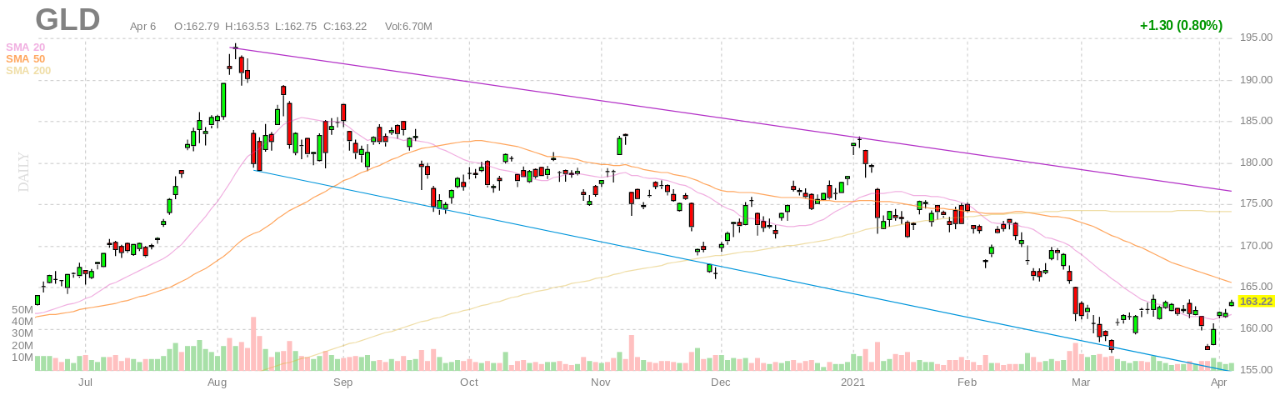
| GLD | GLD | 177.32 | -0.55 | -0.31 | -0.58 |
| SGOL | SGOL | 18.18 | -0.07 | -0.36 | -0.55 |
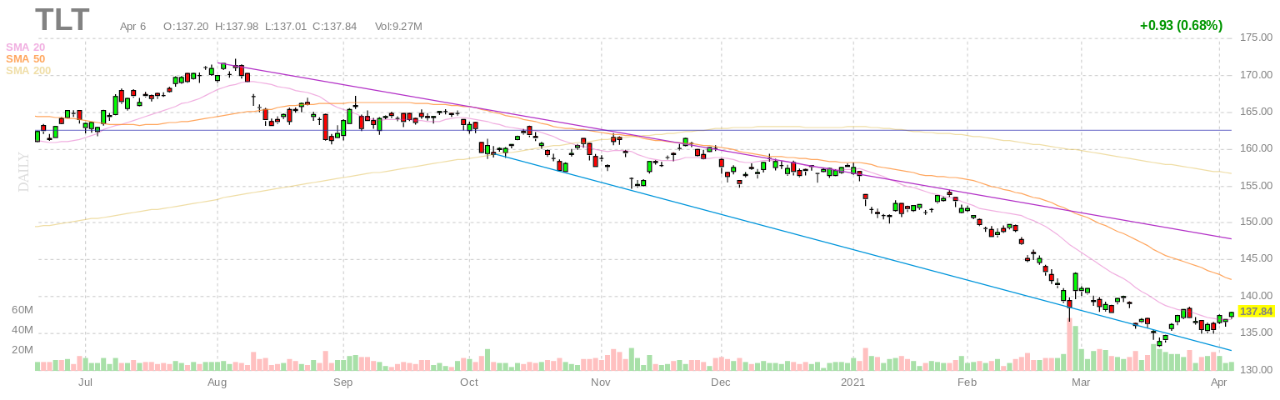
| TLT | TLT | 140.45 | 0.98 | 0.7 | -10.96 |
| VGSH | VGSH | 61.53 | 0 | 0 | -0.11 |
| VIOG | VIOG | 230.55 | 2.43 | 1.07 | 17.22 |
| VIOV | VIOV | 191.02 | 2.6 | 1.38 | 36.03 |
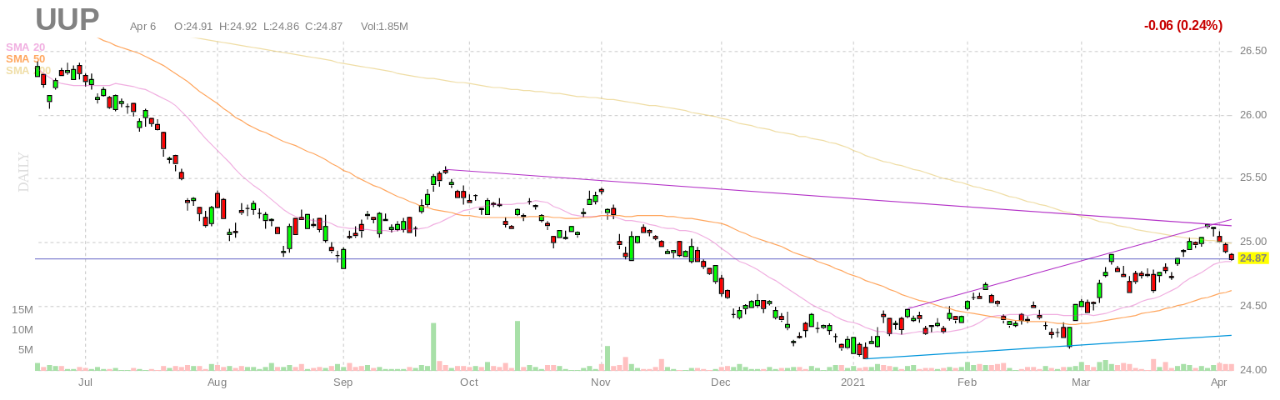
| UUP | UUP | 24.23 | 0.03 | 0.12 | -0.04 |
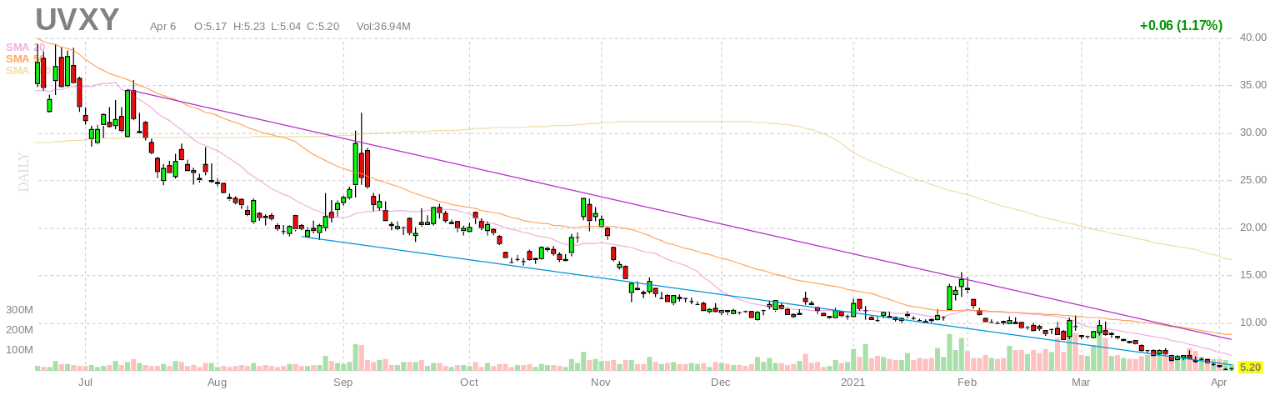
| VIX | VIX | 17.06 | 0.64 | 3.9 | -25.01 |
| XLE | XLE | 55.99 | 0.48 | 0.86 | 47.73 |
| XLF | XLF | 38.12 | -0.1 | -0.26 | 29.31 |
| XLV | XLV | 122.15 | -0.38 | -0.31 | 7.68 |
| XLU | XLU | 64.95 | -0.56 | -0.85 | 3.59 |
| XLRE | XLRE | 45.22 | 0.24 | 0.53 | 23.69 |
| XLK | XLK | 140 | 0.01 | 0.01 | 7.68 |
| XLB | XLB | 87 | 0.16 | 0.18 | 20.18 |
| XLI | XLI | 104.88 | 0.27 | 0.26 | 18.44 |
| XLP | XLP | 70.8 | -0.6 | -0.84 | 4.97 |
| XLY | XLY | 172.41 | 1.38 | 0.81 | 7.23 |
| XLC | XLC | 79.37 | -0.23 | -0.29 | 17.62 |
| ARKK | ARKK | 113.13 | 0.5 | 0.44 | -9.13 |
| VXUS | VXUS | 67.27 | -0.11 | -0.16 | 11.82 |
| EEM | EEM | 55.44 | -0.27 | -0.48 | 7.30 |
| VWO | VWO | 54.56 | -0.23 | -0.42 | 8.88 |
| VEA | VEA | 53.16 | -0.03 | -0.06 | 12.60 |
| VGK | VGK | 69.97 | -0.01 | -0.01 | 16.15 |
| INDA | INDA | 45.36 | -0.03 | -0.08 | 12.78 |
| FXI | FXI | 46.08 | -0.22 | -0.48 | -0.75 |
| DXJ | DXJ | 62.32 | -0.15 | -0.24 | 14.52 |
| ILF | ILF | 32.19 | -0.22 | -0.68 | 9.68 |
Technologies, finance, life, you name it
finance
Market Snapshot from DengSoft, 05/28/21
| Symbol | Close Price | $ Change Today | % Change Today | 21′ YTD Change % | |
| IWM | IWM | 225.5 | -0.15 | -0.07 | 15.02 |
| QQQ | QQQ | 333.93 | 1.05 | 0.32 | 6.44 |
| DIA | DIA | 345.64 | 1.04 | 0.3 | 13.03 |
| SPY | SPY | 420.04 | 0.75 | 0.18 | 12.35 |
| VBR | VBR | 176.1 | -0.02 | -0.01 | 23.83 |
| GLD | GLD | 178.38 | 0.67 | 0.38 | 0.01 |
| TLT | TLT | 138.44 | -0.21 | -0.16 | -12.23 |
| VGSH | VGSH | 61.57 | 0.01 | 0.02 | -0.05 |
| VIOG | VIOG | 225.5 | -0.52 | -0.23 | 14.65 |
| VIOV | VIOV | 183.99 | -0.72 | -0.39 | 31.03 |
| UUP | UUP | 24.22 | 0.02 | 0.08 | -0.08 |
| VIX | VIX | 16.76 | 0.02 | 0.12 | -26.33 |
| XLE | XLE | 52.21 | 0.1 | 0.19 | 37.76 |
| XLF | XLF | 37.99 | 0.07 | 0.18 | 28.87 |
| XLV | XLV | 123.6 | 0.48 | 0.39 | 8.96 |
| XLU | XLU | 65.16 | 0.35 | 0.54 | 3.92 |
| XLRE | XLRE | 43.26 | 0.29 | 0.67 | 18.33 |
| XLK | XLK | 138.4 | 0.49 | 0.36 | 6.45 |
| XLB | XLB | 87.26 | -0.09 | -0.1 | 20.54 |
| XLI | XLI | 105.12 | 0 | 0 | 18.71 |
| XLP | XLP | 70.81 | 0.15 | 0.21 | 4.98 |
| XLY | XLY | 172.84 | -0.24 | -0.14 | 7.50 |
| XLC | XLC | 78.79 | -0.26 | -0.33 | 16.76 |
| ARKK | ARKK | 112.1 | -0.18 | -0.16 | -9.95 |
| VXUS | VXUS | 66.42 | 0.15 | 0.23 | 10.41 |
| EEM | EEM | 54.87 | 0.35 | 0.64 | 6.19 |
| VGK | VGK | 68.95 | 0.17 | 0.25 | 14.46 |
| INDA | INDA | 44.28 | 0.03 | 0.07 | 10.09 |
| FXI | FXI | 46.24 | -0.16 | -0.34 | -0.41 |
| DXJ | DXJ | 61.44 | 0.25 | 0.41 | 12.90 |
| ILF | ILF | 30.63 | 0.59 | 1.96 | 4.36 |
Market Snapshot from DengSoft, 05/27/21
| Symbol | Close Price | $ Change Today | % Change Today | 21′ YTD Change % | |
| IWM | IWM | 225.65 | 2.3 | 1.03 | 15.09 |
| QQQ | QQQ | 332.88 | -1.25 | -0.37 | 6.10 |
| DIA | DIA | 344.6 | 1.33 | 0.39 | 12.69 |
| SPY | SPY | 419.29 | 0.22 | 0.05 | 12.15 |
| VBR | VBR | 176.12 | 1.86 | 1.07 | 23.85 |
| GLD | GLD | 177.71 | 0.07 | 0.04 | -0.36 |
| TLT | TLT | 138.66 | -0.57 | -0.41 | -12.09 |
| VGSH | VGSH | 61.56 | 0 | 0 | -0.06 |
| VIOG | VIOG | 226.02 | 1.59 | 0.71 | 14.92 |
| VIOV | VIOV | 184.71 | 2.4 | 1.32 | 31.54 |
| UUP | UUP | 24.2 | -0.02 | -0.08 | -0.17 |
| VIX | VIX | 16.74 | -0.62 | -3.57 | -26.42 |
| XLE | XLE | 52.11 | 0.04 | 0.08 | 37.49 |
| XLF | XLF | 37.92 | 0.43 | 1.15 | 28.63 |
| XLV | XLV | 123.12 | -0.27 | -0.22 | 8.53 |
| XLU | XLU | 64.81 | -0.44 | -0.67 | 3.37 |
| XLRE | XLRE | 42.97 | -0.05 | -0.12 | 17.53 |
| XLK | XLK | 137.91 | -0.73 | -0.53 | 6.07 |
| XLB | XLB | 87.35 | 0.69 | 0.8 | 20.67 |
| XLI | XLI | 105.12 | 1.42 | 1.37 | 18.71 |
| XLP | XLP | 70.66 | -0.44 | -0.62 | 4.76 |
| XLY | XLY | 173.08 | 0.69 | 0.4 | 7.65 |
| XLC | XLC | 79.05 | 0.3 | 0.38 | 17.15 |
| ARKK | ARKK | 112.28 | 0.85 | 0.76 | -9.81 |
| VXUS | VXUS | 66.27 | 0.15 | 0.23 | 10.16 |
| EMRG | EMRG | 0.66 | 0 | 0 | #N/A |
| EEM | EEM | 54.52 | 0.01 | 0.02 | 5.52 |
| VGK | VGK | 68.78 | 0.21 | 0.31 | 14.18 |
| INDA | INDA | 44.25 | 0.18 | 0.41 | 10.02 |
| FXI | FXI | 46.4 | -0.03 | -0.06 | -0.06 |
| DXJ | DXJ | 61.19 | 0.35 | 0.58 | 12.44 |
| ILF | ILF | 30.04 | 0.41 | 1.38 | 2.35 |
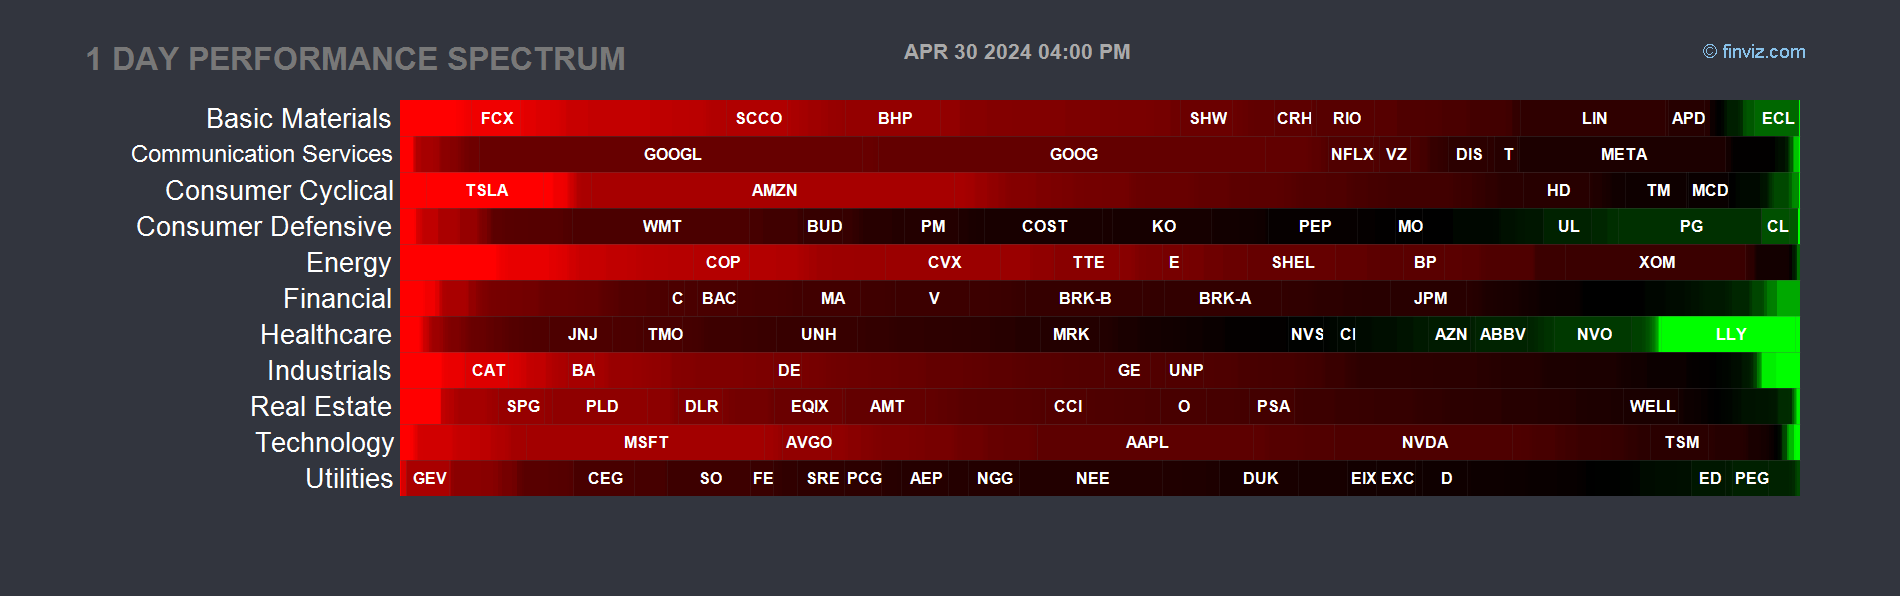
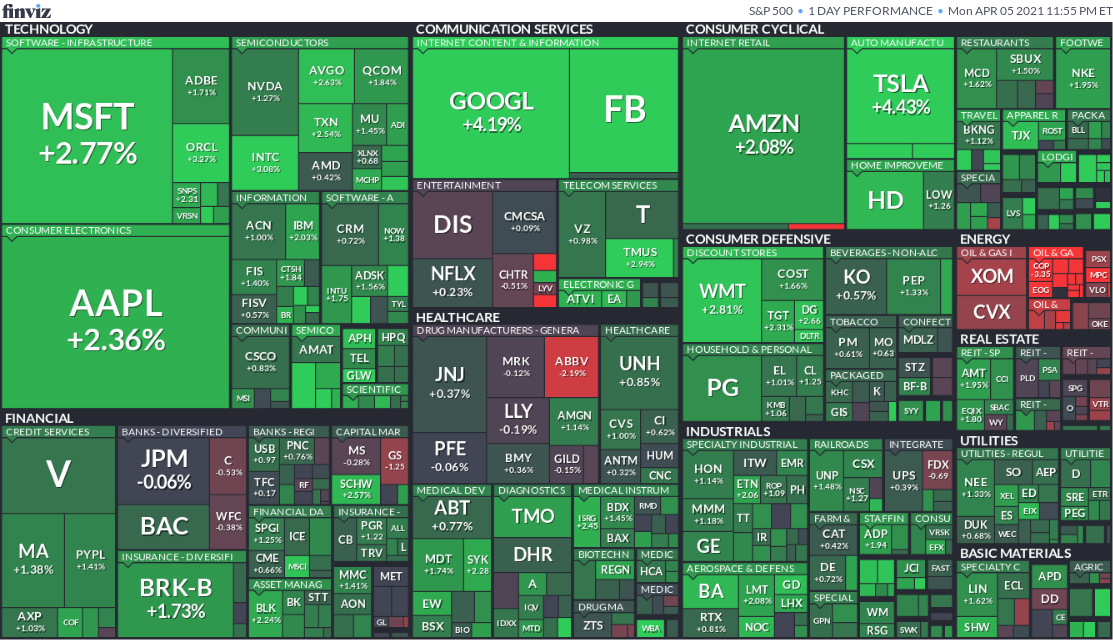
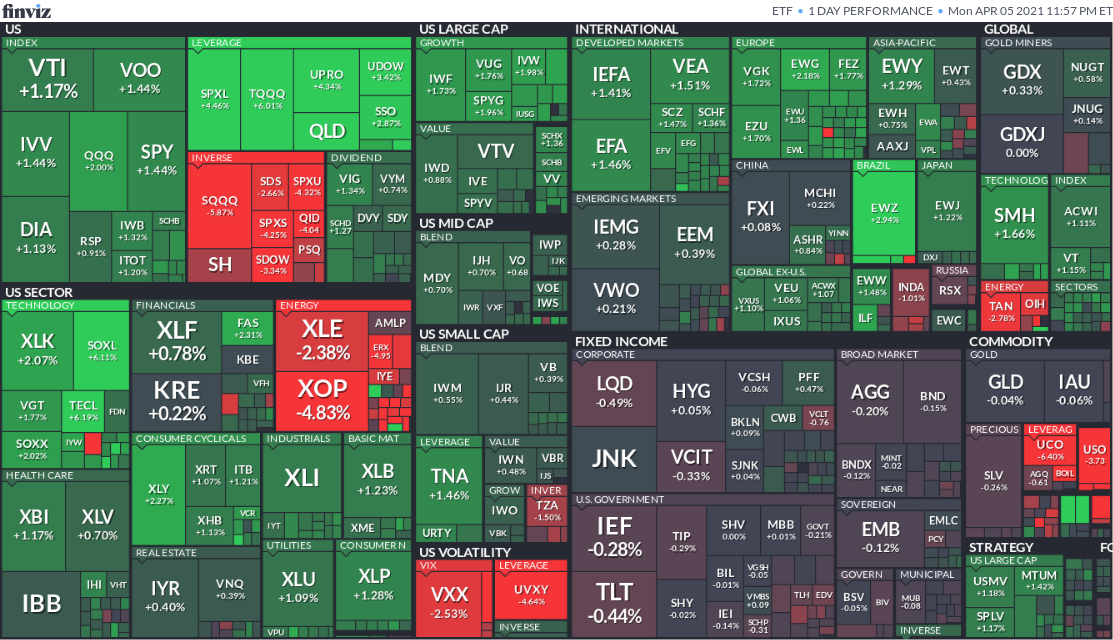
Sector Day Performance Spectrum 4/6/21
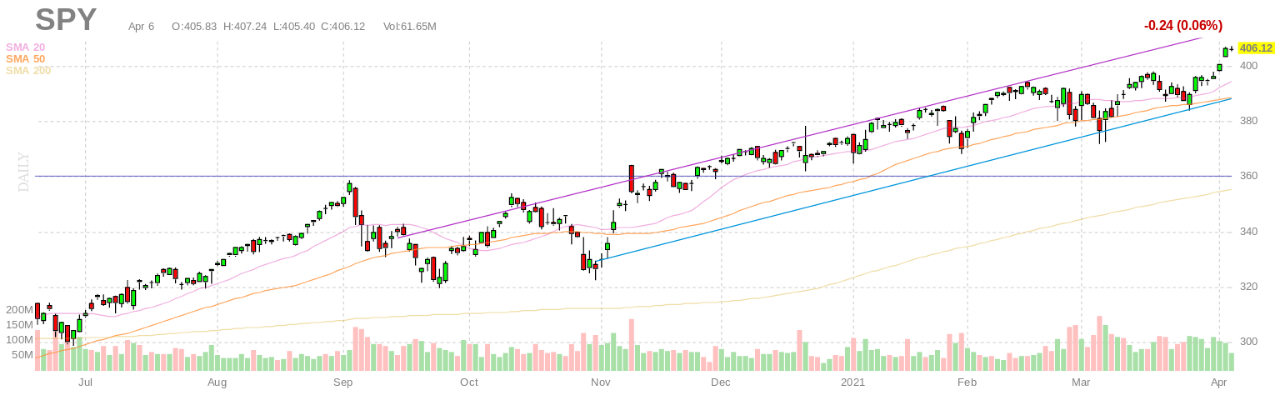
Market Snapshot/Charts for 4/6/21 Tue
- S&P 500
4,073.94-3.97(-0.10%)
Dow 30
33,430.24-96.95(-0.29%)
Nasdaq
13,698.38-7.21(-0.05%)
Russell 2000
2,259.15-5.73(-0.25%)
Crude Oil
59.20+0.55(+0.94%)
Gold
1,744.40+15.60(+0.90%)
Silver
25.21+0.43(+1.74%)
EUR/USD
1.1872+0.006(+0.5114%)
10-Yr Bond
1.6560-0.0640(-3.72%)
GBP/USD
1.3821-0.0086(-0.62%)
USD/JPY
109.723-0.433(-0.3931%)
Bitcoin USD
58,103.91-976.08(-1.65%)
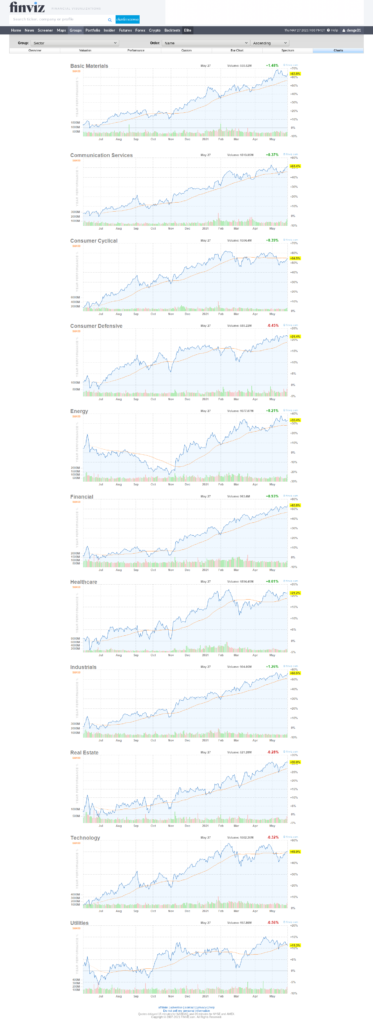
Sector performance
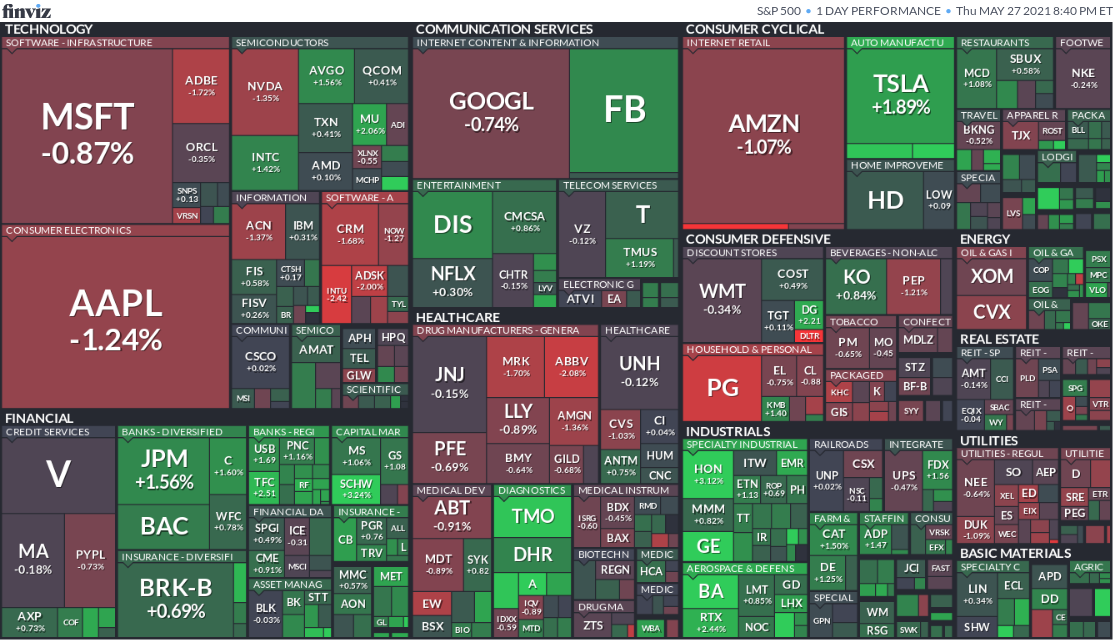
Market maps for today
11 Dividend stock picking criteria: is ENIA a good stock?
Value investor often look into those 11 creteria when evluating a dividend stock:
Criterion #1: Credit Rating Look for stocks with a grade of B+ or higher ( Moody’s www.moodys.com and Standard and Poor’s www.standardandpoors.com)
ENIA passed with its Baa3 rating. See the news below:
New York, December 19, 2019 — Moody’s Investors Service (“Moody’s“) today changed to positive from stable the outlook on Enel Américas S.A. (ENIA). Moody’s also affirmed the ‘Baa3‘ senior unsecured rating of ENIA.Dec 19, 2019
Criterion #2: Cash Flow Assessment
A strong cash flow allows a company to scale its operations and develop innovative products. It provides the means to fund dividend payouts . We look for Net Income growing at 5-10% per year (from Income Statement) – we also prefer stable or growing Operating Cash flow (From Cash Flow Statement).
We may use financial data from morningstar.
ENIA:
Net Income:
| 2017 | 2018 | 2019 | TTM | 3-Yr Trend |
|---|---|---|---|---|
| 0.71 | 1.20 | 1.61 | 1.61 | Increase every year |
Operating cash flow: ?
Not found in morning star for the last 3 years somehow.
Criterion #3: Cash & Cash Equivalents
We prefer a company with consistent growth in cash and cash equivalents, as seen from Balance Sheets from financial web sites such as morning star.
ENIA:
| 2017 | 2018 | 2019 | Q4 2019 |
|---|---|---|---|
| 1.58 | 2.05 | 2.04 | 2.04 |
Criterion #4: Debt Repayment Capacity
We prefer a company with a debt coverage ratio of at least 3:1.
We can use data from morning star.
debt coverage ratio = Net Income / (Interest Expenses + Other Payments)
Other payments could be principle, sinking, lease payments etc.
Interest Coverage is another ratio similar to debt coverage ratio above. The ratio is calculated by dividing a company’s earnings before interest and taxes (EBIT) by the company’s interest expenses for the same period.
Per WSJ, as of 09/11/2020, ENIA’s Interest Coverage is 3.29. PASSED.
https://www.wsj.com/market-data/quotes/ENIA/financials
Criterion #5: Management Performance
Read company reports as well as analyst reports. Understand its management team. Know the company’s long term growth and expansion plans.
ENIA: Recent quarterly call transcripts:
https://seekingalpha.com/symbol/ENIA/earnings/transcripts
Criterion #6: Current Dividend Yield
It should be at least 4% or 5%. ENIA: 12.51% (Paid Semiannually)
Criterion #7: Dividend Growth Rate
It should be at least 5%. Check out dividend.com and know the company’s dividend policy. ENIA: 5 years: 4.60%
Criterion #8: Dividend Payout Ratio
It should be less than 60% (check out dividend.com). Otherwise it cannot fund its growth.
Payout ratio of 60%-70% is acceptable only if its dividend yield is compelling (8-10%). Considering selling it if its payout ratio is too high.
ENIA Dividend Payout Ratio:
59.77%, PASSED (Based on Cash Flow, https://www.marketbeat.com/stocks/NYSE/ENIA/dividend/)
But other sites are showing different numbers:
122.43% (FWD PAYOUT RATIO, https://www.dividend.com/dividend-stocks/utilities/electric-utilities/enia-enersis-americashttps://www.marketbeat.com/stocks/NYSE/ENIA/dividend/-sa/#tm=3-ticker-best-div-capture&r=ES%3A%3ADividendStock%3A%3AStock%23ENIA–NYSE&f_28=true&only=meta%2Cdata%2Cthead)
114.03% – FAIL ??? (https://seekingalpha.com/symbol/ENIA/dividends/dividend-safety)
Criterion #9: ROE
ROE for the last 3 or more years is 12% or higher.
TTM ROE is at least 15%. Use financial data from morningstar/Key Ratios/Profitability.
During the past 13 years, Enel Americas/ENIA’s highest ROE % was 19.87%. The lowest was 7.46%. And the median was 11.22%. (https://www.gurufocus.com/term/ROE/NYSE:ENIA/ROE–ttm/Enel-Americas)
Enel Americas/ENIA’s return on equity, or ROE TTM, is 11.16% , as of 9/11/2020 (https://www.zacks.com/stock/chart/ENIA/fundamental/return-on-equity-ttm).
Criterion #10: Insider Activity
Buy when insiders are holding or buying more shares. Data can be extracted from:
a. Morningstar/Insiders/Insider Activity
b. Yahoo Finance/Insider Transactions
c. Zacks.com/More Research/Insiders
ENIA: No inside activities for the last 6 months: https://in.finance.yahoo.com/quote/ENIA/insider-transactions/
Criterion #11: Intrinsic value
Buy at or below its instrinsic value because your performance is determined not only by dividends but also capital appreciation.
ENIA: $10.66, current price $7.21 USD as of 09/11/2020. PASSED.
as of
| 12/31/2019 | 10.658 |
5G CIENA stock price: a similar ROE method to calculate its intrinsic value
Use a similar ROE model method described here:
Use the above mentioned calculator,
Cash Taken Out of Business ($): I entered 0 * This is dividends recieved for 1 year.
Current Book Value ($): 14.57 * We need to know this so we can determine the base value that’s changing.
Average Percent Change in Book Value Per Year (%): 6.67 * This will determine the estimate BV at the end of the next 10 years.
Years: 5 * This will most likely be 10 (if you’re comparing a 10 year federal note).
(Discount Rate) 10 Year Federal Note (%): 0.80 * Look up the ten year treasury note by clicking on this text.
Intrinsic Value ($): 19.33607699236469
I got this number as its intrinsic value:
19.33607699236469
The main difference is, I used 9% as discount rate when calculating NPV, while this calculator uses treasury 10-year note rate (0.80%).
Related blog posts:
ciena stock price: $44.28 is still overvalued based on my valuations
In my previous blog posts, I laid out a plan how to evaluate stocks using three methods.
In the blog post on how to evaluate a stock, I listed three methods when valuing a stock:
- P/E Multiple method
- DCF model
- Return on equity valuation method
I later dive deep into PE multiple method, and calculate CIEN’s intrinsic value as 39.7379.
If I believe my intrinsic value of CIEN, I will consider buying it below $39.73 per share. That’s close to its price 37.34 on Mar 27, 2020.
Before the broad stock market drop last week, CIEN was traded at 60.07 when market closed on Wednesday 9/2.
Yahoo Finance site says this stock price now is Near Fair Value.
According to GuruFocus, Ciena Intrinsic Value: Projected FCF : USD 33.40 (As of 9/5/2020).
Per https://trendshare.org/stocks/CIEN/view:
| CIEN Price (Ciena Corporation stock price per share) |
$59.93 | |
| [?] | CIEN Fair Price (based on intrinsic value) |
$25.84 |
| [?] | CIEN Safety Price (based on a variable margin of safety) | $15.50 |
In my latest blog post, I used ROE model and calculated the intrinsic value of CIEN as $23.74639 .
I later said,
The current share price $44.28 of CIEN as of Friday 9/5/2020 is very much overvalued, in my opinion.By the way, Ciena price target lowered to $37 from $53 at Barclays. Reiterate Underweight.Barclay’s analyst Tim Long lowered the firms price target on Ciena to $37 from $53 and keeps an Underweight weight rating on the shares. The company’s fiscal Q3 beat on sales, margin, and earnings; but guidance surprised to the downside.
So based on the above research, I think $23.74639 is CIEN’s intrinsic value, and the safe price to buy is around $15.50 for the margin of safety.
The current share price $44.28 of CIEN as of Friday 9/5/2020 is very much overvalued, in my opinion.
Disclaimer: I am just sharing my information, not suggesting you to buy any stocks or investments. Use the info here at your own risk. Please make your own judgements when making investment decisions.